Combining blood gene expression, plasma cellfree DNA, and urine chemokines to diagnose rejection in kidney transplant recipients
John Friedewald1, Lihui Zhao1, Sook Park1, Michael Abecassis2, Veronica LaCombe3, Genevieve Hanna3, Blade Robelly1, Thomas Whisenant4, Sunil Kurian5, Steve Kleiboeker3.
1Northwestern University, Chicago, IL, United States; 2University of Arizona, Tucson, AZ, United States; 3Eurofins - Viracor, Lenexa, KS, United States; 4UC San Diego, San Diego, CA, United States; 5Scripps Health, La Jolla, CA, United States
The CTOT-08 Investigators.
Introduction: Reliable, non-invasive biomarkers or rejection and under-immunosuppression will aid in personalized immunosuppression management. Combining Gene Expression Profiles (GEP) and dd-cfDNA in the blood improved diagnostic performance for rejection. We tested the hypothesis that combining Urine CXCL9 and CXCL10, both established biomarkers of rejection, with GEP and dd-cfDNA would further improve diagnostic performance for rejection in kidney transplant patients.
Methods: We studied 344 biopsy-paired samples taken from 214 pts enrolled in the CTOT-08 trial. Biopsy based clinical phenotypes included clinical acute rejection (cAR, N=26), subclinical acute rejection (subAR, N=60), acute dysfunction but no rejection (ADNR, N=47) and Normal surveillance biopsies (TX, N=211). Urine CXCL9/CXCL10 values were normalized by dividing by urine creatinine from the same sample. A multi-variable logistic regression model was built including the log_cfDNA values, TruGraf v1.3 microarray probability score (0-100), and the urine CXCL9/Cr, and CXCL10/Cr values. AUC values were validated by bootstrap resampling.
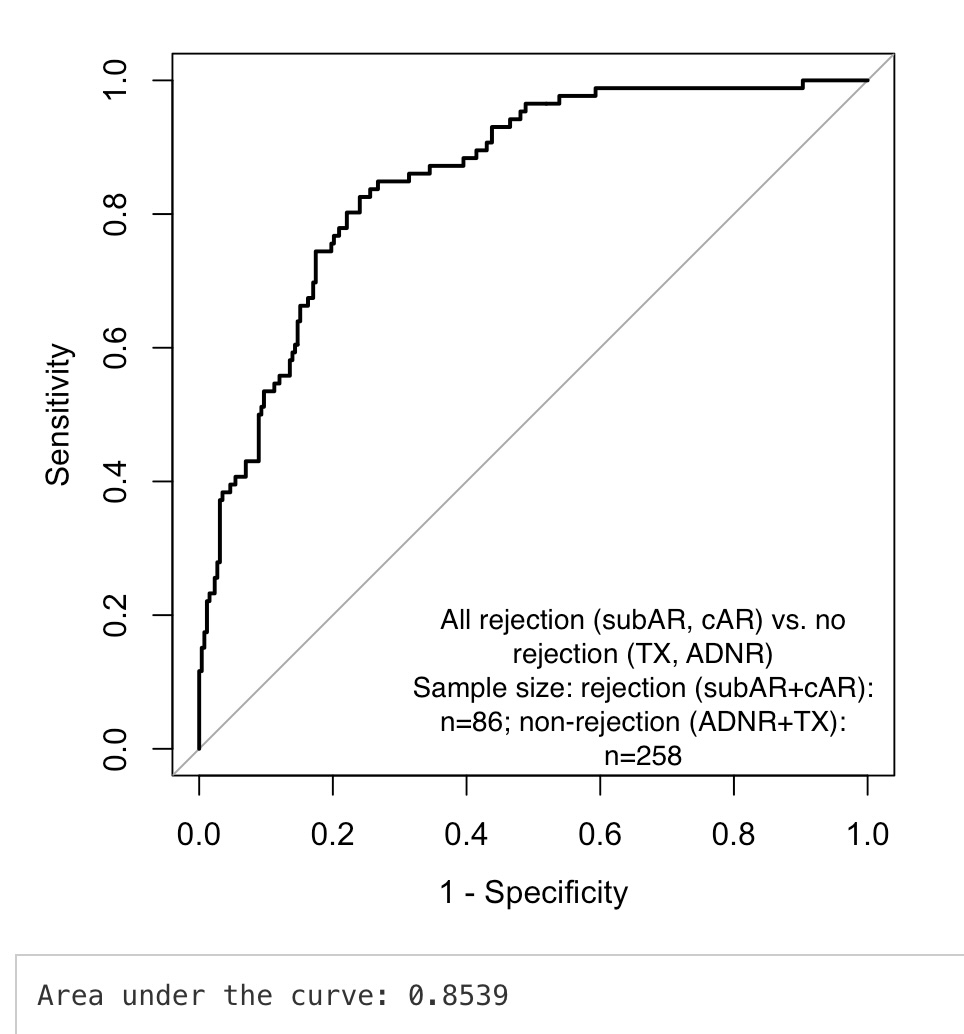
Results: Results are shown in Figure 1, which examined all rejections (cAR + subAR, n=86) compared to no rejection (ADNR + TX, n=258). The combined biomarker algorithm yielded an AUC = Area under the curve: 0.853 with a bootstrap resampling validated AUC: 0.844 suggesting minimal overfitting. This gave an NPV=87% and PPV=63%.In the surveillance biopsies only (subAR vs. TX), the AUC=0.865.In the for-cause biopsies (cAR vs. ADNR), the AUC=0.879.
Conclusion: Combining established biomarkers in the blood and urine using a logistic regression model yields excellent diagnostic performance for diagnosing or excluding rejection in patients with both surveillance and for-cause biopsies. Further validation is needed to establish the performance of this biomarker combination in additional cohorts.
[1] Biomarkers
[2] Rejection
[3] Kidney Transplant
[4] Gene Expression Profile
[5] Cell-Free DNA
[6] Urine Chemokines