Impact of race on peripheral blood gene expression profile and renal function changes: An interim report of the TRULO study
David Leeser1, James Fleming2, John Holman2, Isioma Agboli2, William Irish1, Karim Soliman3.
1East Carolina University School of Medicine, Greenville, NC, United States; 2Medical Affairs, Transplant Genomics, Inc, Framingham, MA, United States; 3Medical University of South Carolina, Charleston, SC, United States
Purpose: The purpose of this interim analysis was to identify differences between races in prevalence of positive gene expression profile (GEP) and associated outcomes over up to 2 years of follow-up during the conduct of the TRULO study.
Methods: The TruGraf Long-term Clinical Outcomes Study (TRULO Study) is a prospective, multicenter, observational, registry study that began enrolling patients in September 2020. Over 2,000 subjects across 50 transplant centers in the US have been enrolled. GEP and dd-cfDNA are drawn at enrollment (baseline) then every 3 months over the 2-year study period. A Dynamic Panel Model was used to measure the time-dependent impact of GEP testing results on change in eGFR and the results were compared between Caucasian and African American recipients.
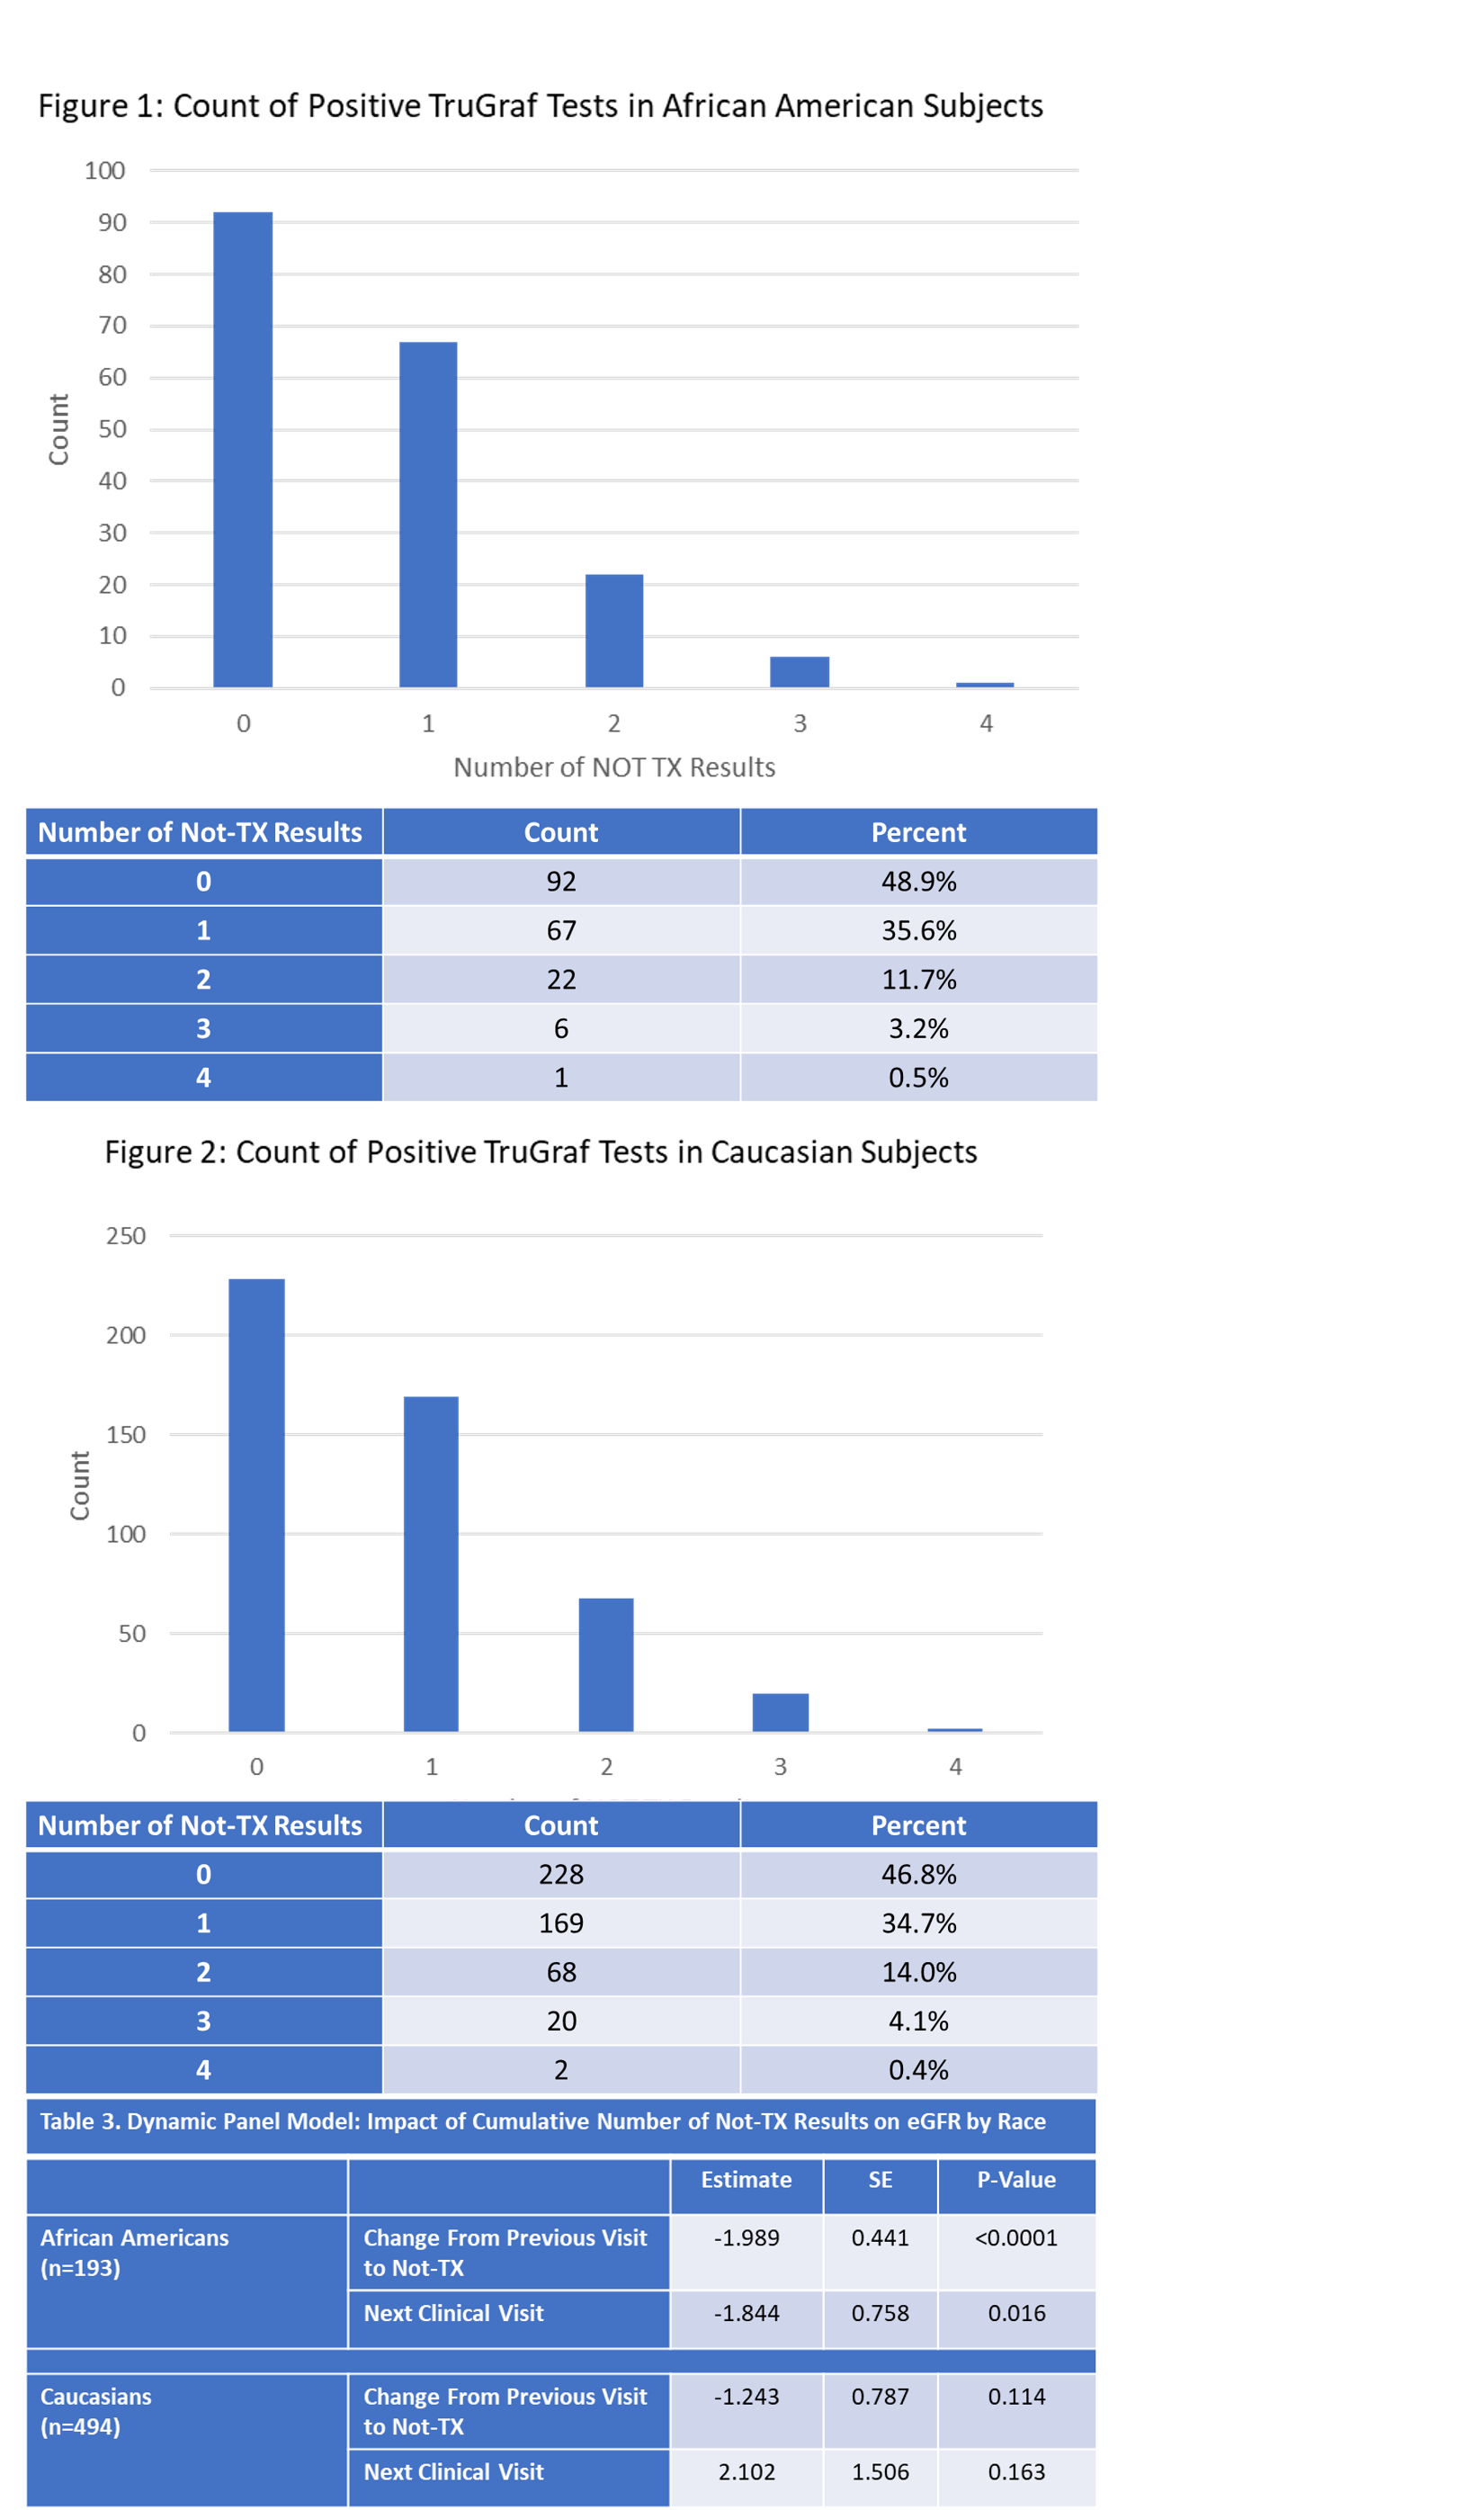
Results: There were 826 subjects with at least 12 months of follow up. Median time post-transplant at the time of enrollment was 2 years. Of the 826 subjects, 494 were Caucasian and 193 were African American. The number and proportion of positive GEP tests did not differ between Caucasian and African American subjects (Tables 1 and 2, Figures 1 and 2). In African Americans, there was a 1.989 ml/min decrease in eGFR concurrently for each additional positive test. Additionally, the subsequent eGFR was significantly decreased by an additional 1.844 ml/min (Table 3). In Caucasians, there was a trend toward a decrease in eGFR at the time of each positive GEP test, which then rebounded by the next visit (Table 4)
Conclusions: In this interim analysis, there is no difference seen between the proportion of positive GEP tests by race, but the impact of positive tests appears to be greater on African American recipients. There is evidence of a significant proportional decrease in eGFR for each positive TruGraf test at the time of testing and at the next visit.
[1] Gene expression profile
[2] African American
[3] Renal Function
[4] Biomarker