Diagnostic performance of peripheral blood gene expression at 2 months post-transplant and interim correlation of tests with renal function over 2 years
Sunil M Kurian1, James Fleming2, Bethany Barrick2, Allison Martin1, Chris Marsh1.
1Scripps Center for Organ and Cell Transplantation, La Jolla, CA, United States; 2Transplant Genomics, Inc, Framingham, MA, United States
Purpose: The purpose of this interim analysis was to test the diagnostic performance of TruGraf gene expression profile (GEP) against surveillance biopsies at 2 months post-transplant, as it is currently validated at only 3 months and beyond. In addition, an interim correlation of repeated GEP tests with renal function was evaluated in an ongoing study.
Methods: This is an ongoing single center prospective study of patients receiving GEP at months 2, 6, 9, 12, 15, 18, 21, and 24 as part of clinical care within the first 2 years of KTx. Surveillance biopsies are performed at 2, 12, and 24 months. Target enrollment is 30 subjects. For diagnostic performance, repeat biopsies to assess rejection efficacy were excluded. Copper-pearson 95% CI were used for sensitivity and specificity; standard logit CI were used for NPV and PPV. Linear regression eGFR slopes were analyzed using analysis of covariance. Statistical analysis of continuous variables was performed using Mann-Whitney U.
Results: Thirty subjects were enrolled between 6/2020 and 9/2022 with end of follow-up expected for 9/2024. Mean age of the cohort is 59, 53% are male, and 80% are Caucasian. Twenty-three subjects had biopsy-paired GEP results at 2 months. There were 2 rejections (9% prevalence) at 2 months and 5 rejections (7% prevalence) all through follow-up, after exclusion of 2 biopsies following up on rejection. Diagnostic performance demonstrated excellent NPV for the month 2 GEP tests, as well as for all biopsy-paired GEP tests at this point during follow-up (Tables 1 & 2). An interim analysis evaluating GEP testing patterns over time was performed; subjects were divided into those that had all “TX” (negative; n=15) and those that had at least 1 “Not-TX” (positive; n=15). The ALL TX cohort had had similar eGFR at baseline as the ≥1Not-TX cohort (mean eGFR 45.6 vs 41.4 ml/min/1.73m2, respectively). The ≥1Not-TX cohort showed no change eGFR over follow-up, while the ALL TX cohort demonstrated an improvement of 0.57ml/min/1.73m2 per month (p=0.05 between slopes, Figure 1). Median eGFR at month 2 was 47 vs 42 ml/min/1.73m2 (p=0.345) (Figure 2) while the median eGFR at 24 months was 60 vs 46 ml/min/1.73m2 for the ALL TX cohort compared to the ≥1Not-TX cohort, respectively (p=0.011), although only 15 subjects had a 24 month eGFR. Occurrence of acute rejection did not impact 24-month eGFR (Figure 3).
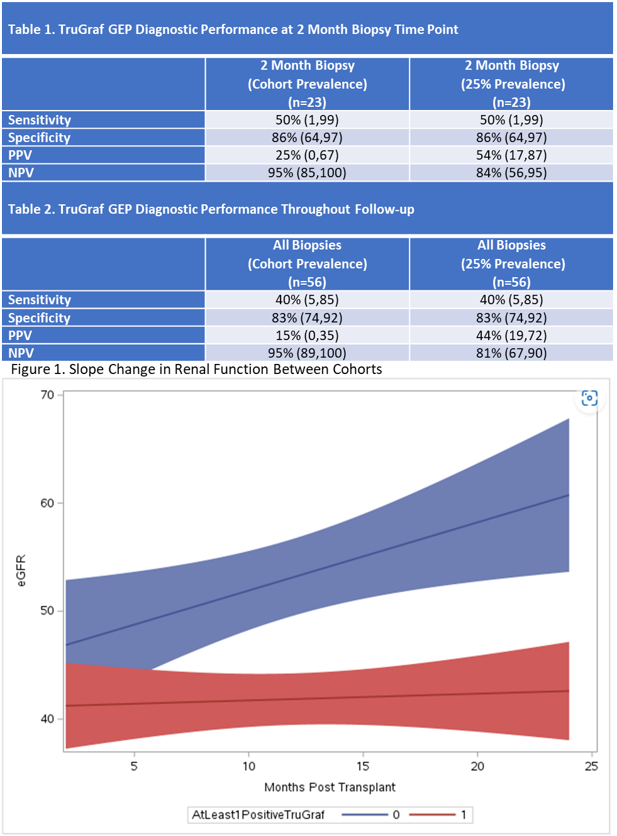
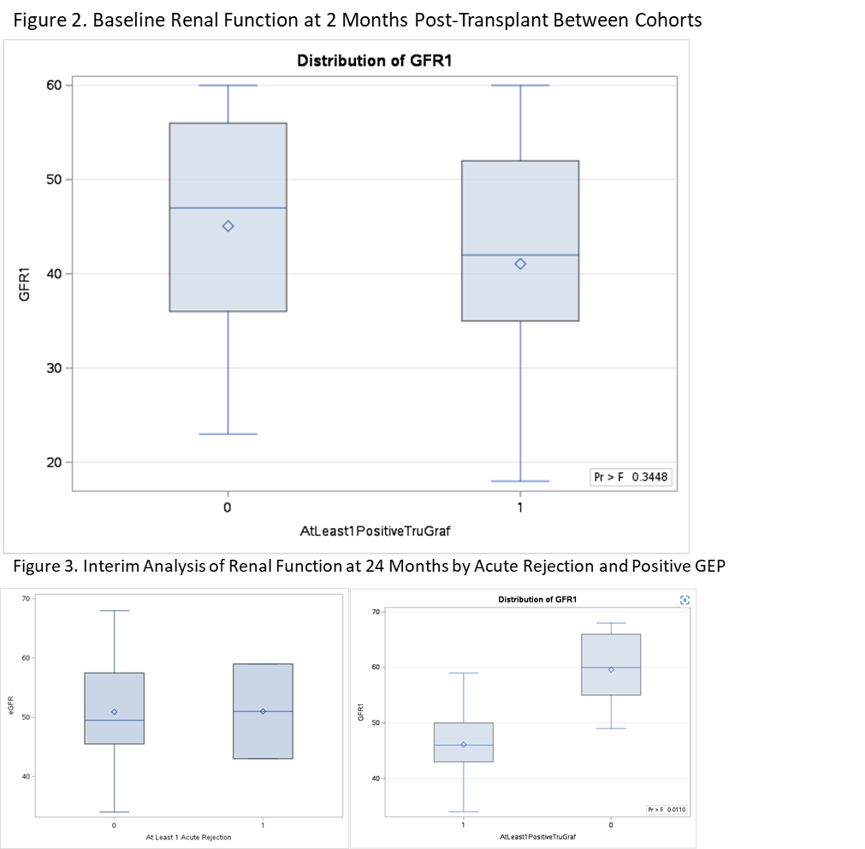
Conclusions: TruGraf GEP demonstrated good NPV for 2 month biopsies, perhaps allowing for earlier use. Additionally, an interim evaluation demonstrates an association between improved renal function and all negative GEP results. In a limited number of patients with 24 month results, patients with all TX results had significantly better eGFR at the end of follow-up, whereas AR did not impact renal function. At the end of follow-up, clinical decision-making and avoidance of biopsies based on GEP results will be analyzed, as well as further analysis of eGFR.
[1] Gene Expression Profile
[2] Kidney Transplant
[3] Renal Function
[4] Biomarker