Longitudinal change patterns in estimated glomerular filtration rate in a European population of living kidney donors
Manuela Almeida1,2, Pedro Pereira1,2, José. Silvano1,2, Catarina Ribeiro1, Sofia Pedroso1,2, Sandra Tafulo2,3, Anabela Rodrigues1,2, Miguel Silva Ramos4, La Salete Martins1,2, Jorge Malheiro1,2.
1Nephrology, ULS de Santo António, Porto, Portugal; 2UMIB, Instituto Ciencias Biomédicas Abel Salazar, Porto, Portugal; 3Instituto Português do Sangue e Transplantação, IPST-IP, Porto, Portugal; 4Urology, ULS de Santo António, Porto, Portugal
Nephrology, Dialysis and Transplantation, UMIB.
Background: A living donor(LD) kidney transplant(KT) is the preferred treatment for end-stage renal disease, but LD safety is paramount. We sought to evaluate the longitudinal changes in estimated glomerular filtration rate (eGFR) in our cohort of LD.We explored several subgroups in search of distinct signatures of eGFR change according to LD characteristics at the time of donation.
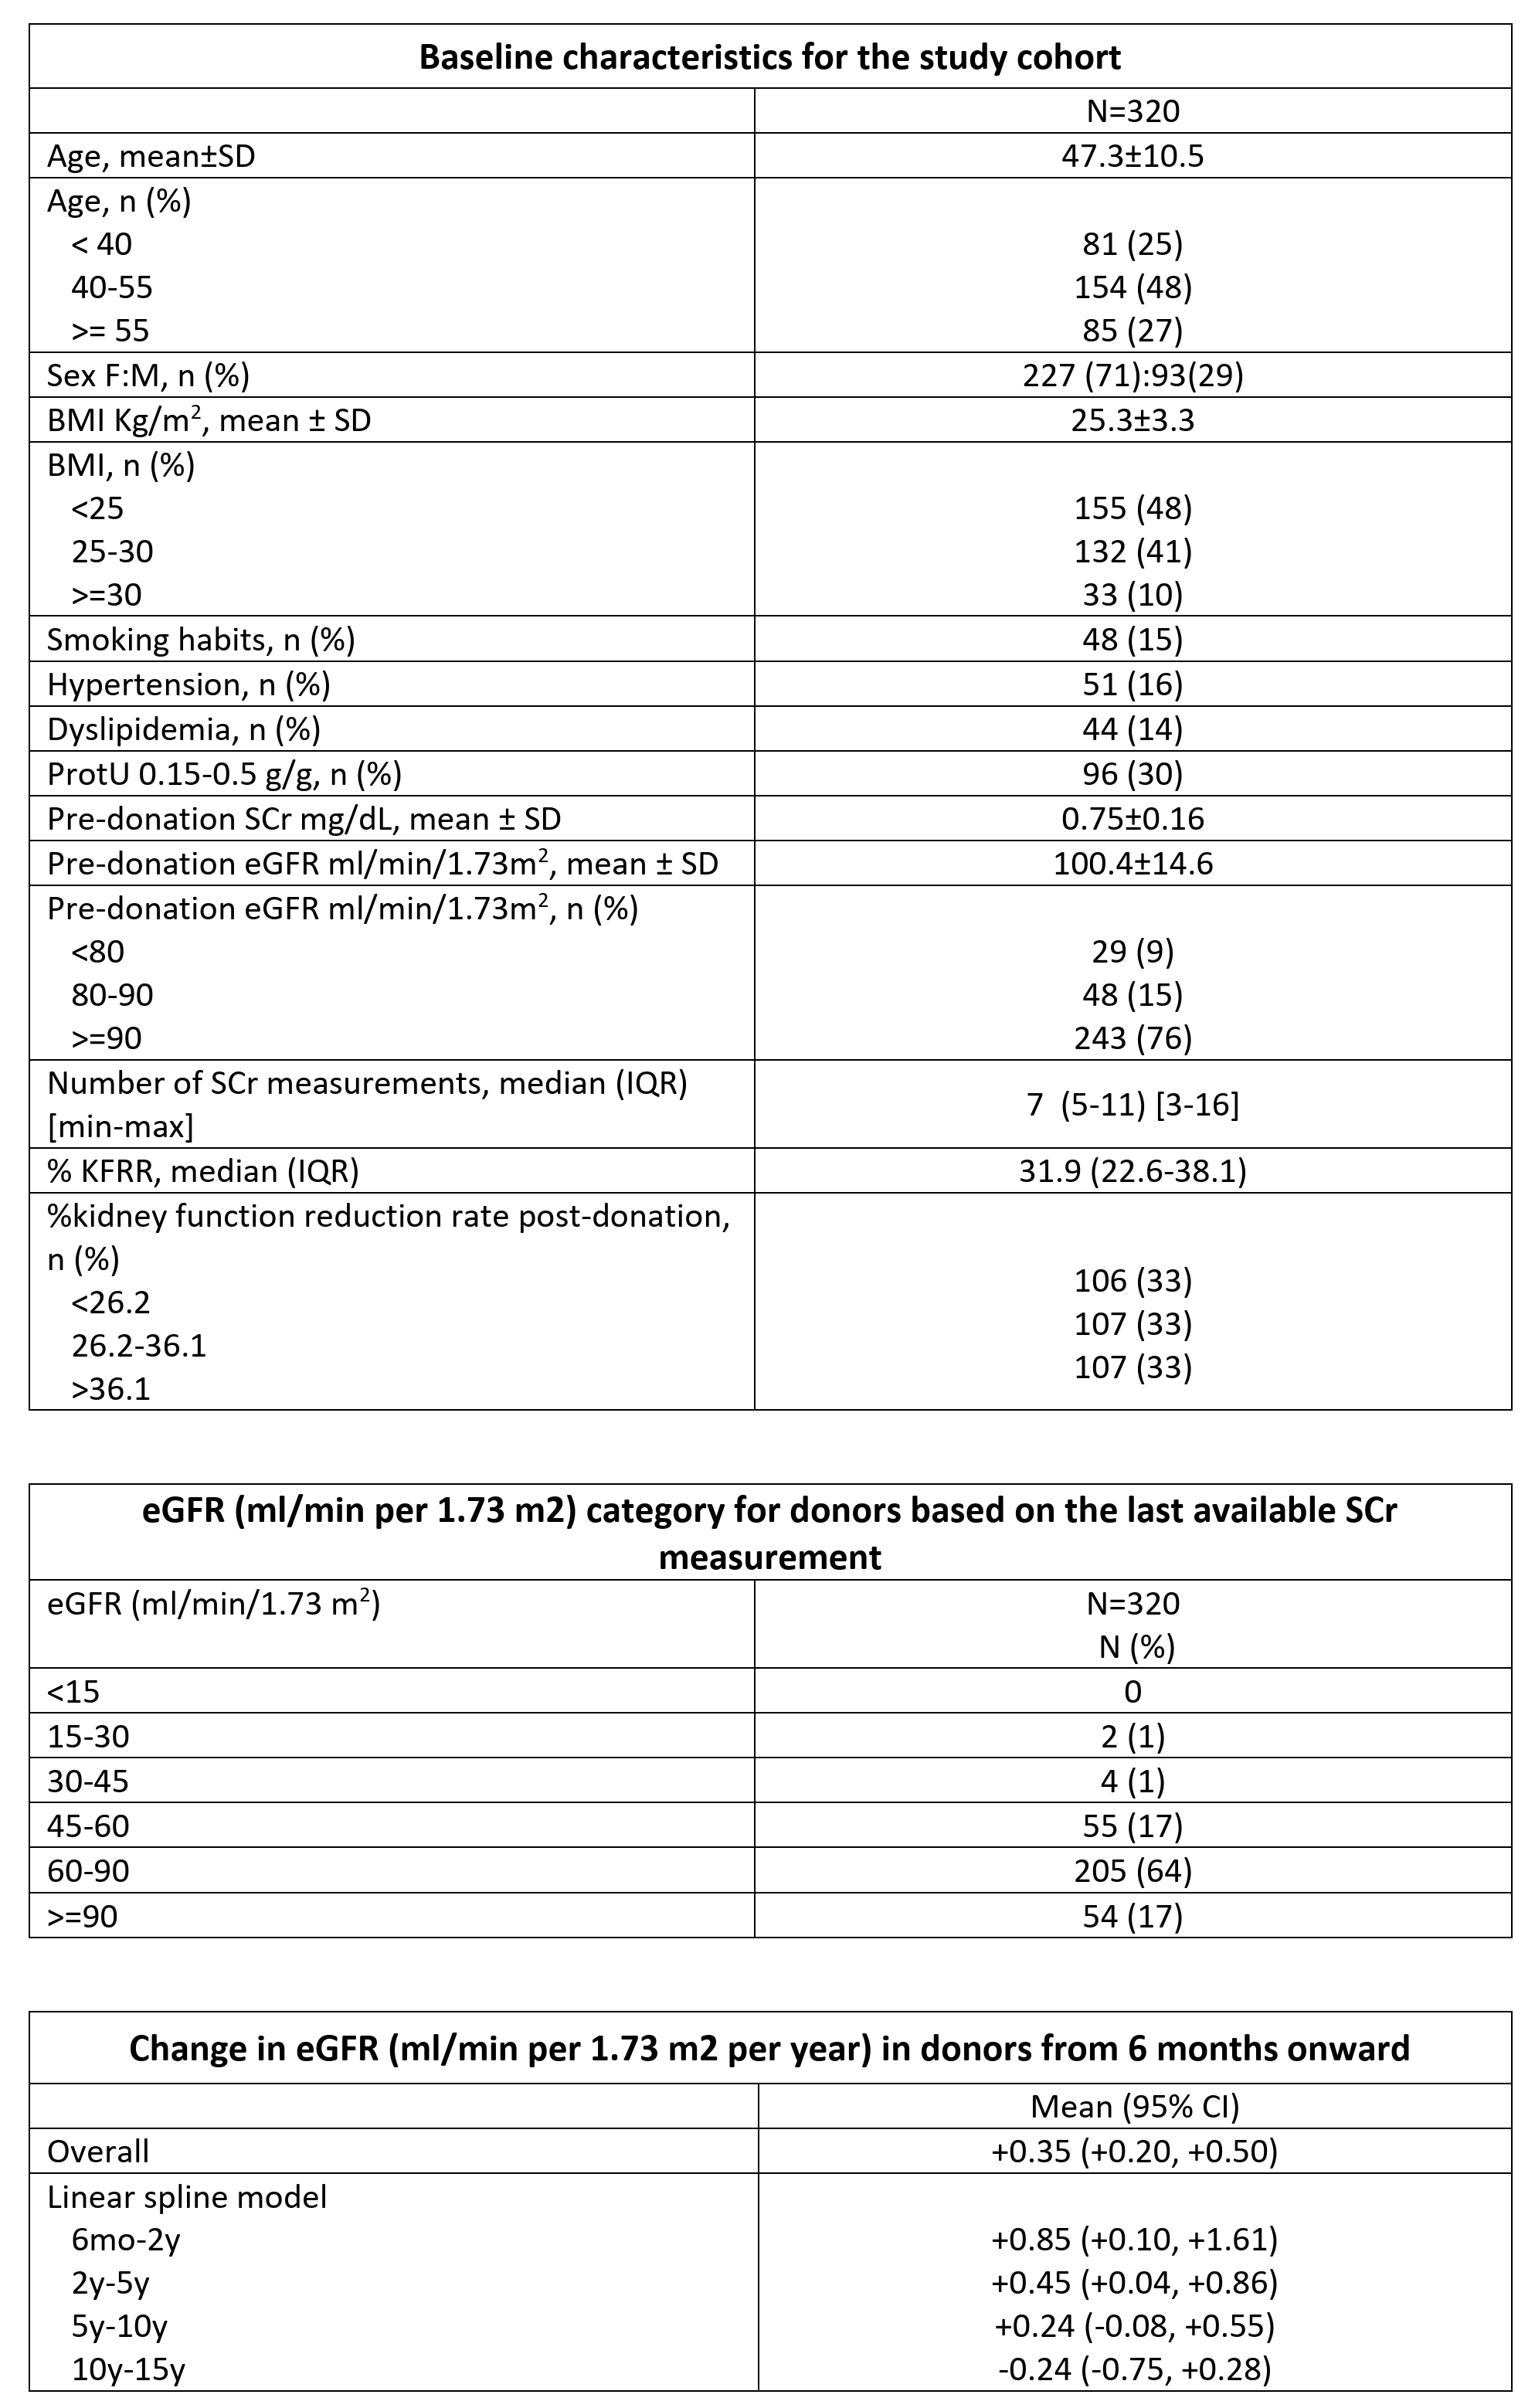
Methods: We retrospectively studied 320 LDs submitted to nephrectomy at our center from 1998 to 2020. The primary outcome was the change in eGFR until 15-years(Y) post-donation. Subgroup analysis considered: age, sex, obesity, hypertension, smoking, proteinuria, pre-donation eGFR and the kidney function reduction rate (%KFRR) post-donation [-(eGFR6months(M)postdonation–eGFRpredonation)/eGFRpredonation*100]. These same variables were included in the multivariable model. Donor eGFR change between 6M-to 15-y post-donation was assessed by univariate and multivariable linear mixed regression model that imputed subject-specific random effects on an unstructured covariance matrix.
Results: Overall, the LKD presented an average change in eGFR 6M onward of +0.35 (95%CI +0.20 to +0.50)ml/min/1.73m2/year. The period with the highest increase was from 6M to 2 Y with a mean increase of eGFR of +0.85 (95%CI +0.10 to +1.61) ml/min/1.73m2/year. Recovery after donation plateau at 10Y, after which the calculated mean change in eGFR was -0.24 (95%CI -0.75 to +0.28) ml/min/1.73m2/year.
At multivariable analysis considering the 15-years span, normal-weight donors presented a significantly better recovery of eGFR+0.59 95%CI +0.37 to +0.80), compared to overweight +0.35 (95%CI -0.14 to +0.56) or obese donors -0.18 (95%CI -0.68 to +0.31) ml/min/1.73m2, p=0.020.
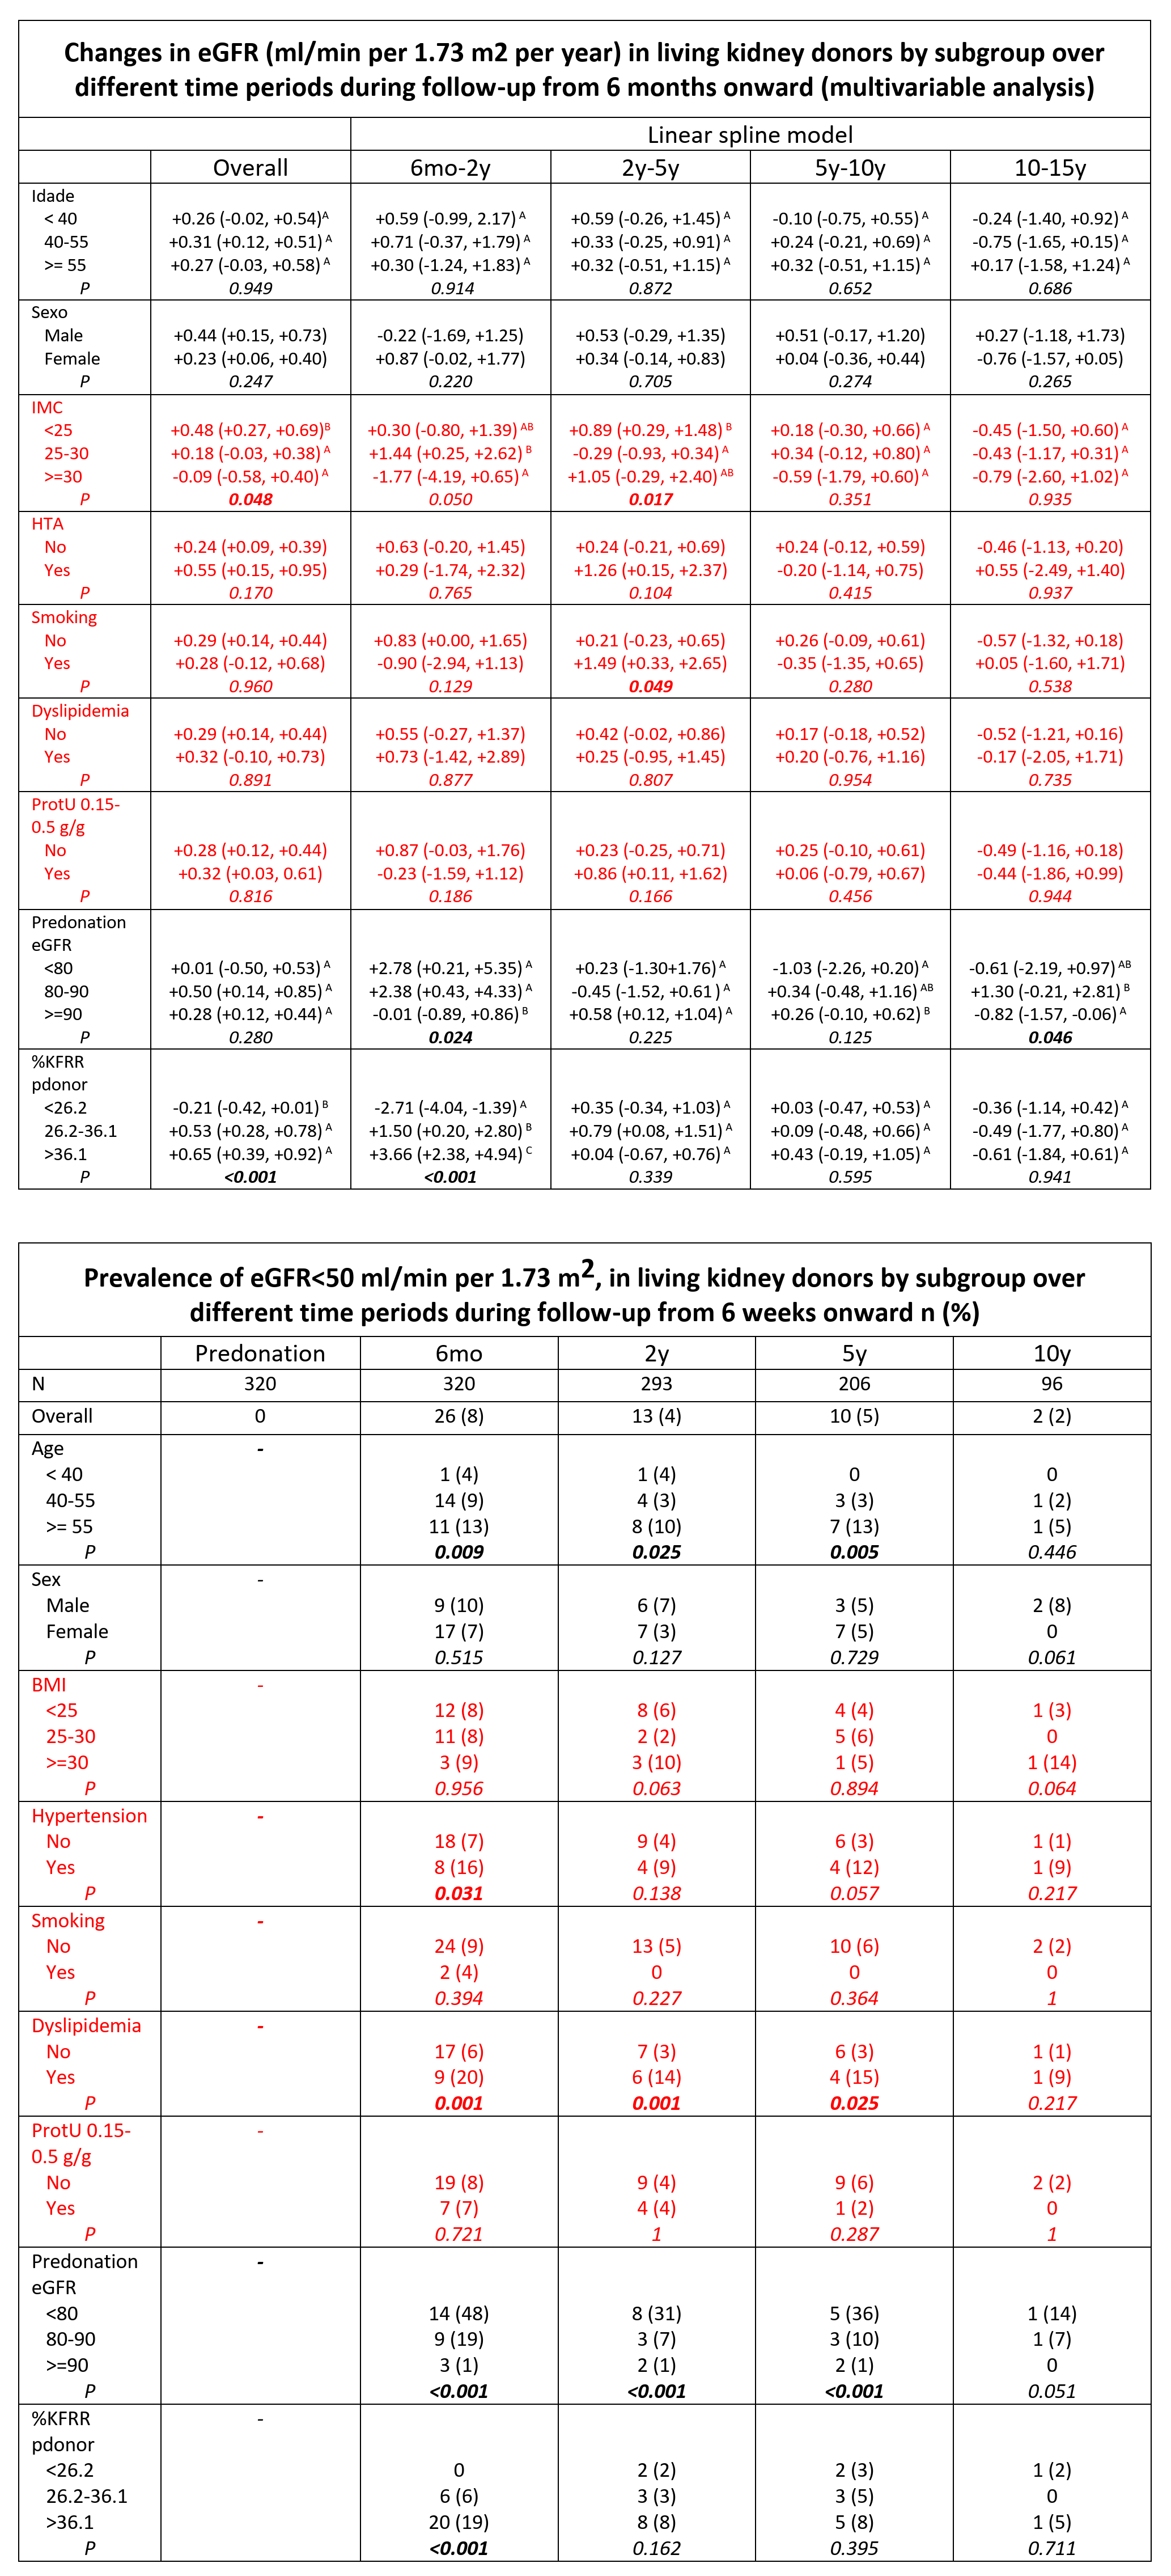
Noteworthy, these significantly different recovery trajectories only hold for the first 5Y. Smokers presented a later recovery of kidney function, with a maximum improve in eGFR of +1.66 in smokers (95%CI +0.48 to +2.83) being observed in the 2-5Y span, while, in non-smokers, that change was highest in the 6 M-2Y span(+1.31(+0.48 to +2.14) ml/min/1.73m2). At multivariable analysis, the subgroup with a lower KFRR (< 26.2%) had a significantly higher decrease in eGFR overall of -0,21 (-0.42to+0.01) ml/min/1.73m2 compared to the groups with higher KFRR. In the linear spline analysis, these differences only hold for the span 6M-2Y. Moreover, an eGFR<50 ml/min/1.73m2 was a rare event, with a 5% or less prevalence in the 2-15Y span. It was significantly associated with the eGFR pre-donation in the first 5Y.
Conclusions: Our data shows that eGFR post-donation recovery is significant and may last until 10Y post-donation. These observations confirm that in a carefully selected cohort of LD, a significant kidney function loss or accelerated decline is exceptional. However, some subgroups of donors presented a more ominous kidney function trajectory pattern, pointing to the necessity of tailored follow-up.
[1] living donor
[2] kidney function
[3] eGFR
[4] change patterns