Time-varying relative changes in donor-derived cell-free DNA (dd-cfDNA) during rejection and dnDSA detection in primary and repeat kidney transplant recipients (KTR)
Sandesh Parajuli1, Neetika Garg1, Shree Patel2, Kevin Pinney2, Didier Mandelbrot1.
1Transplant Nephrology, University of Wisconsin-Madison, Madison, WI, United States; 2CareDx, Inc, Brisbane, CA, United States
Introduction: Serial monitoring of dd-cfDNA and relative change from baseline over time can provide meaningful information beyond absolute dd-cfDNA thresholds. Previous studies described relative change between 2 sequential dd-cfDNA results. However, relative change between sequential results varies based on frequency of testing or time elapsed between draws. Comparing change from patient-specific baselines can have added utility. A paucity of data explores time-varying dd-cfDNA change from baseline during clinical events. We describe dd-cfDNA trajectories from baseline before & after acute rejection (AR) and dnDSA detection in KTR.
Method: We included all KTR from 02/2019 to 03/2022 with serial dd-cfDNA testing (AlloSure®). Primary analysis compared time-varying (3mo before - 6mo after) change in dd-cfDNA from baseline in KTR with ≥3 prior results & first AR on biopsy [AR] to patients with ≥3 prior results and no AR on biopsy [No-AR]. Month 0 dd-cfDNA was drawn ≤30 days before biopsy. Baseline dd-cfDNA was defined as the patient specific nadir result ≤120 days before biopsy. Similar baseline analysis was done in KTR at time of dnDSA detection and in a sub-group of repeat KTR. Reference change value (RCV), the difference that must be exceeded between 2 sequential results for a significant change to occur, was calculated in a quiescent population as 2½ × 1.96 × (CVA2 + CVI2)½. Quiescence was defined as not meeting criteria for any of the following: serum creatinine rise ≥30%, proteinuria ≥3grams, dnDSA, infection, or rejection or glomerulopathy on biopsy.
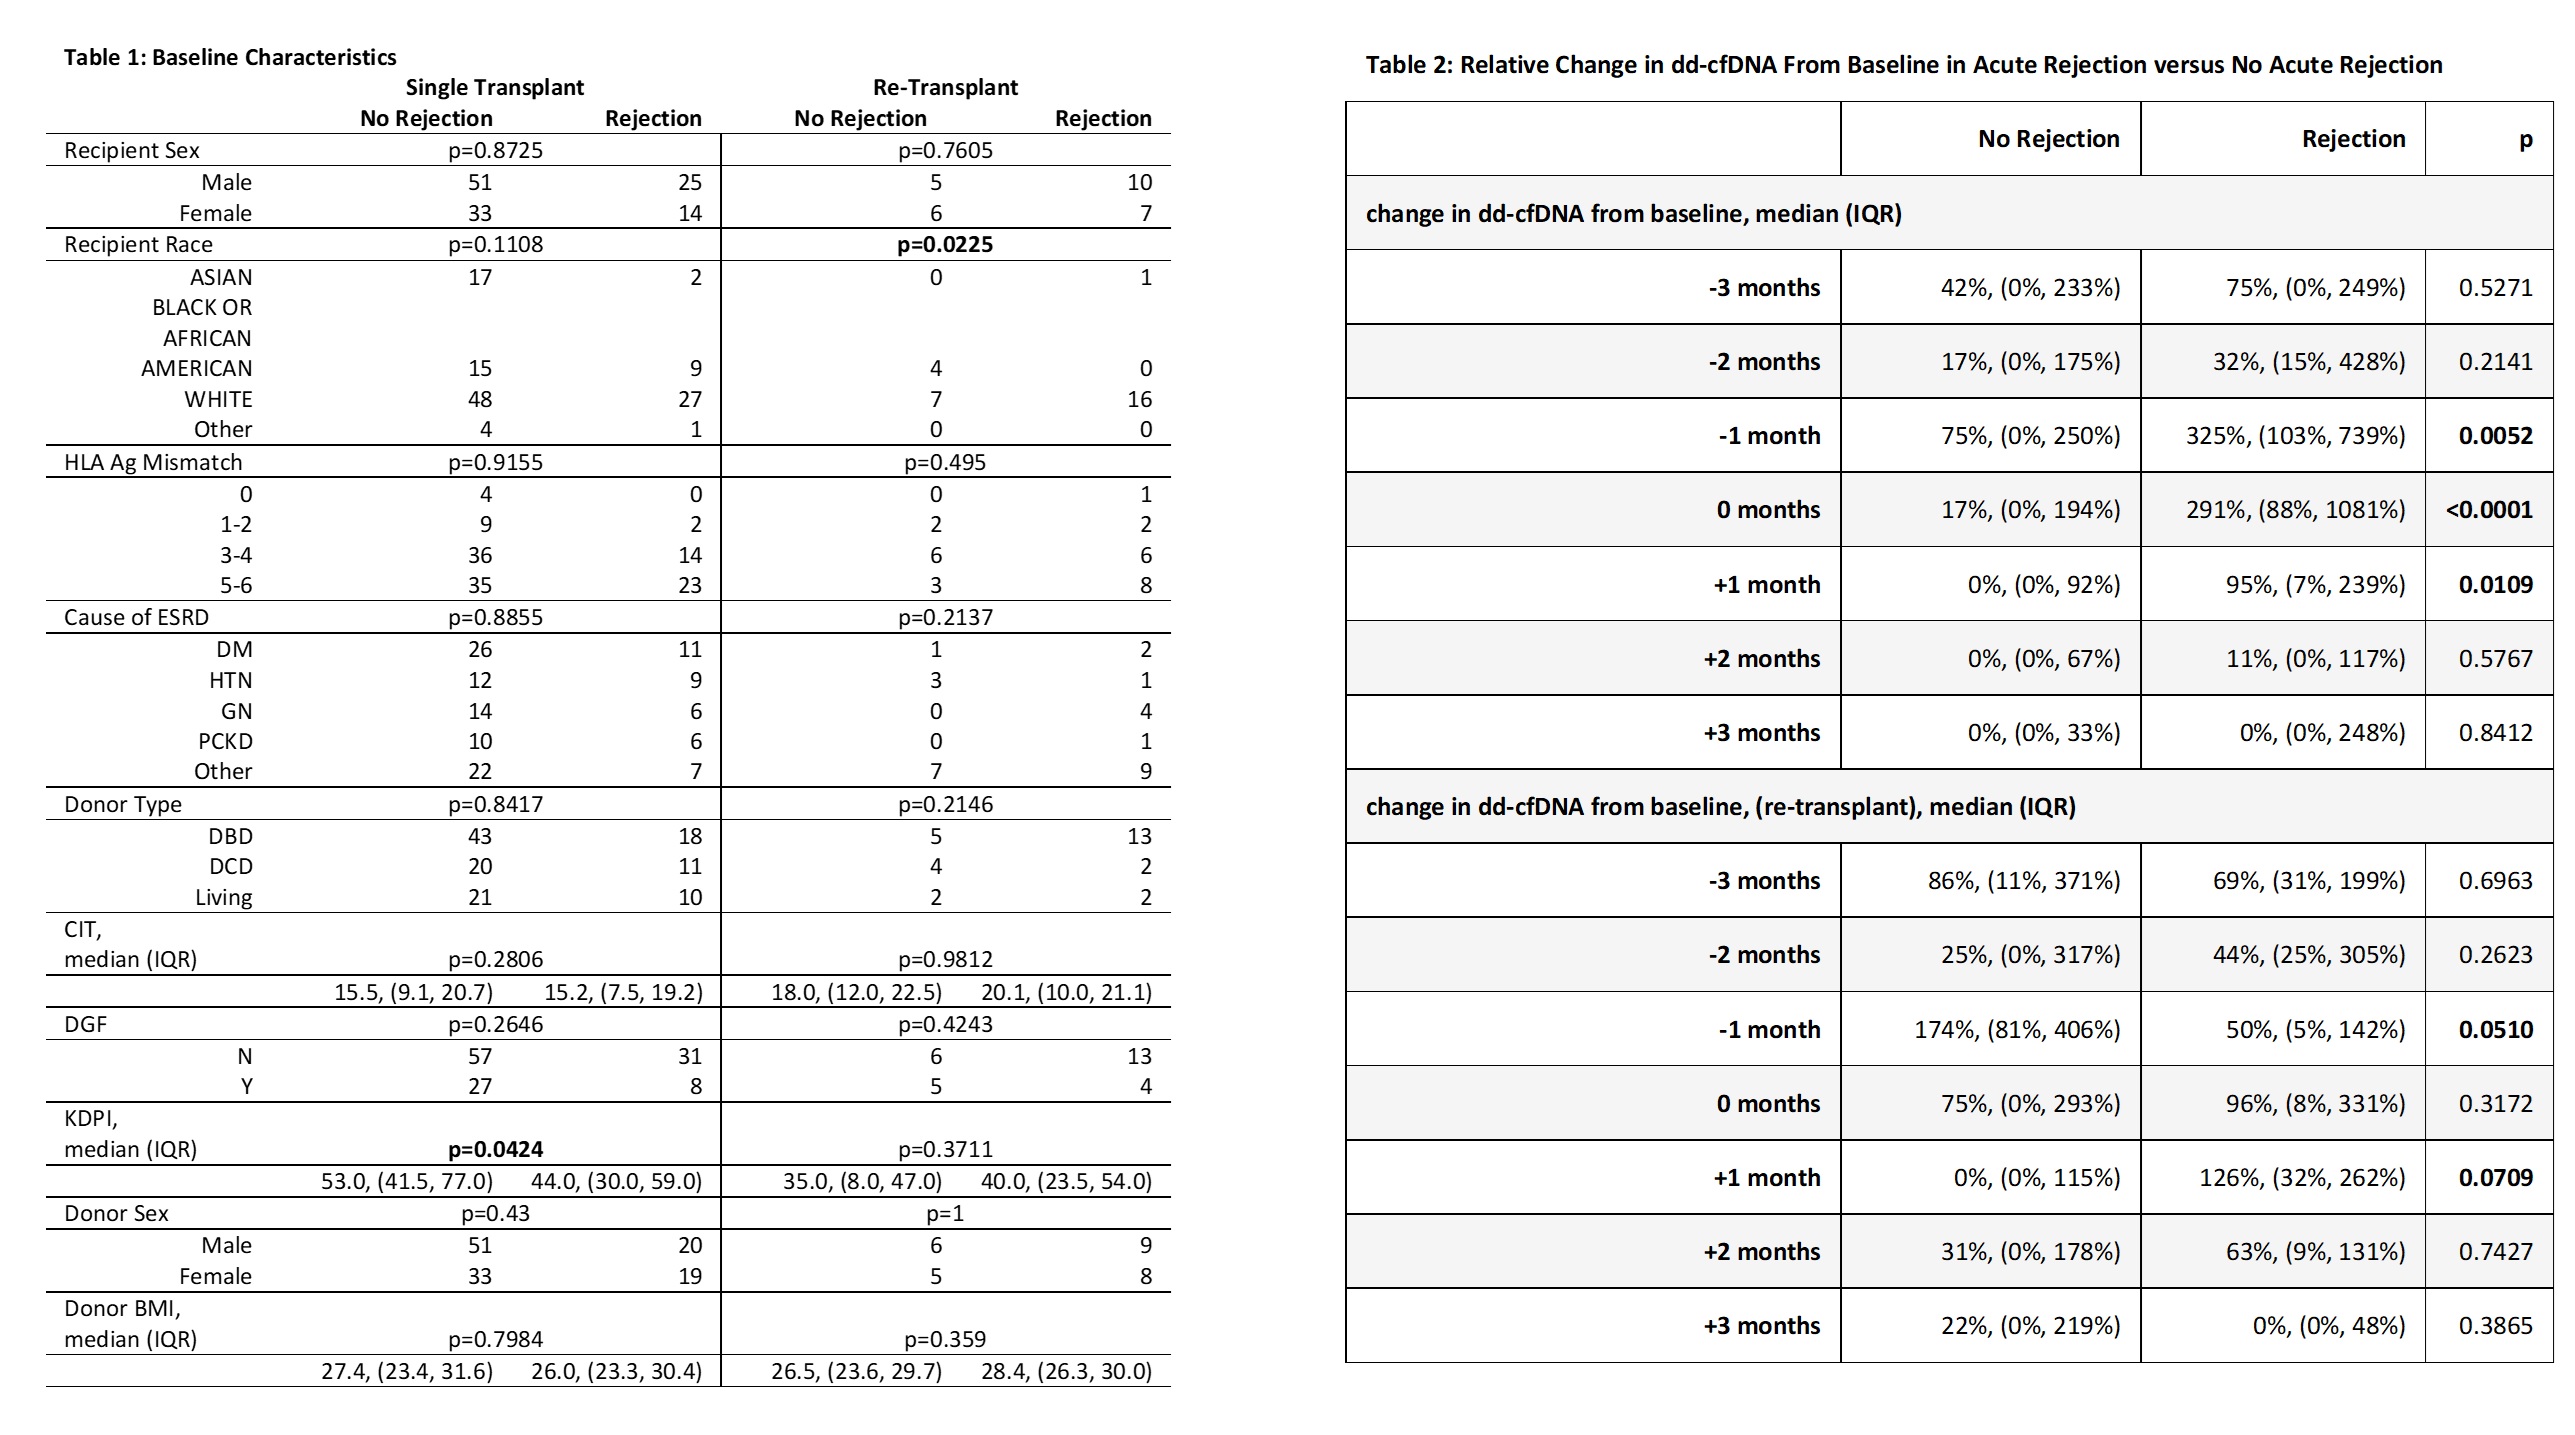
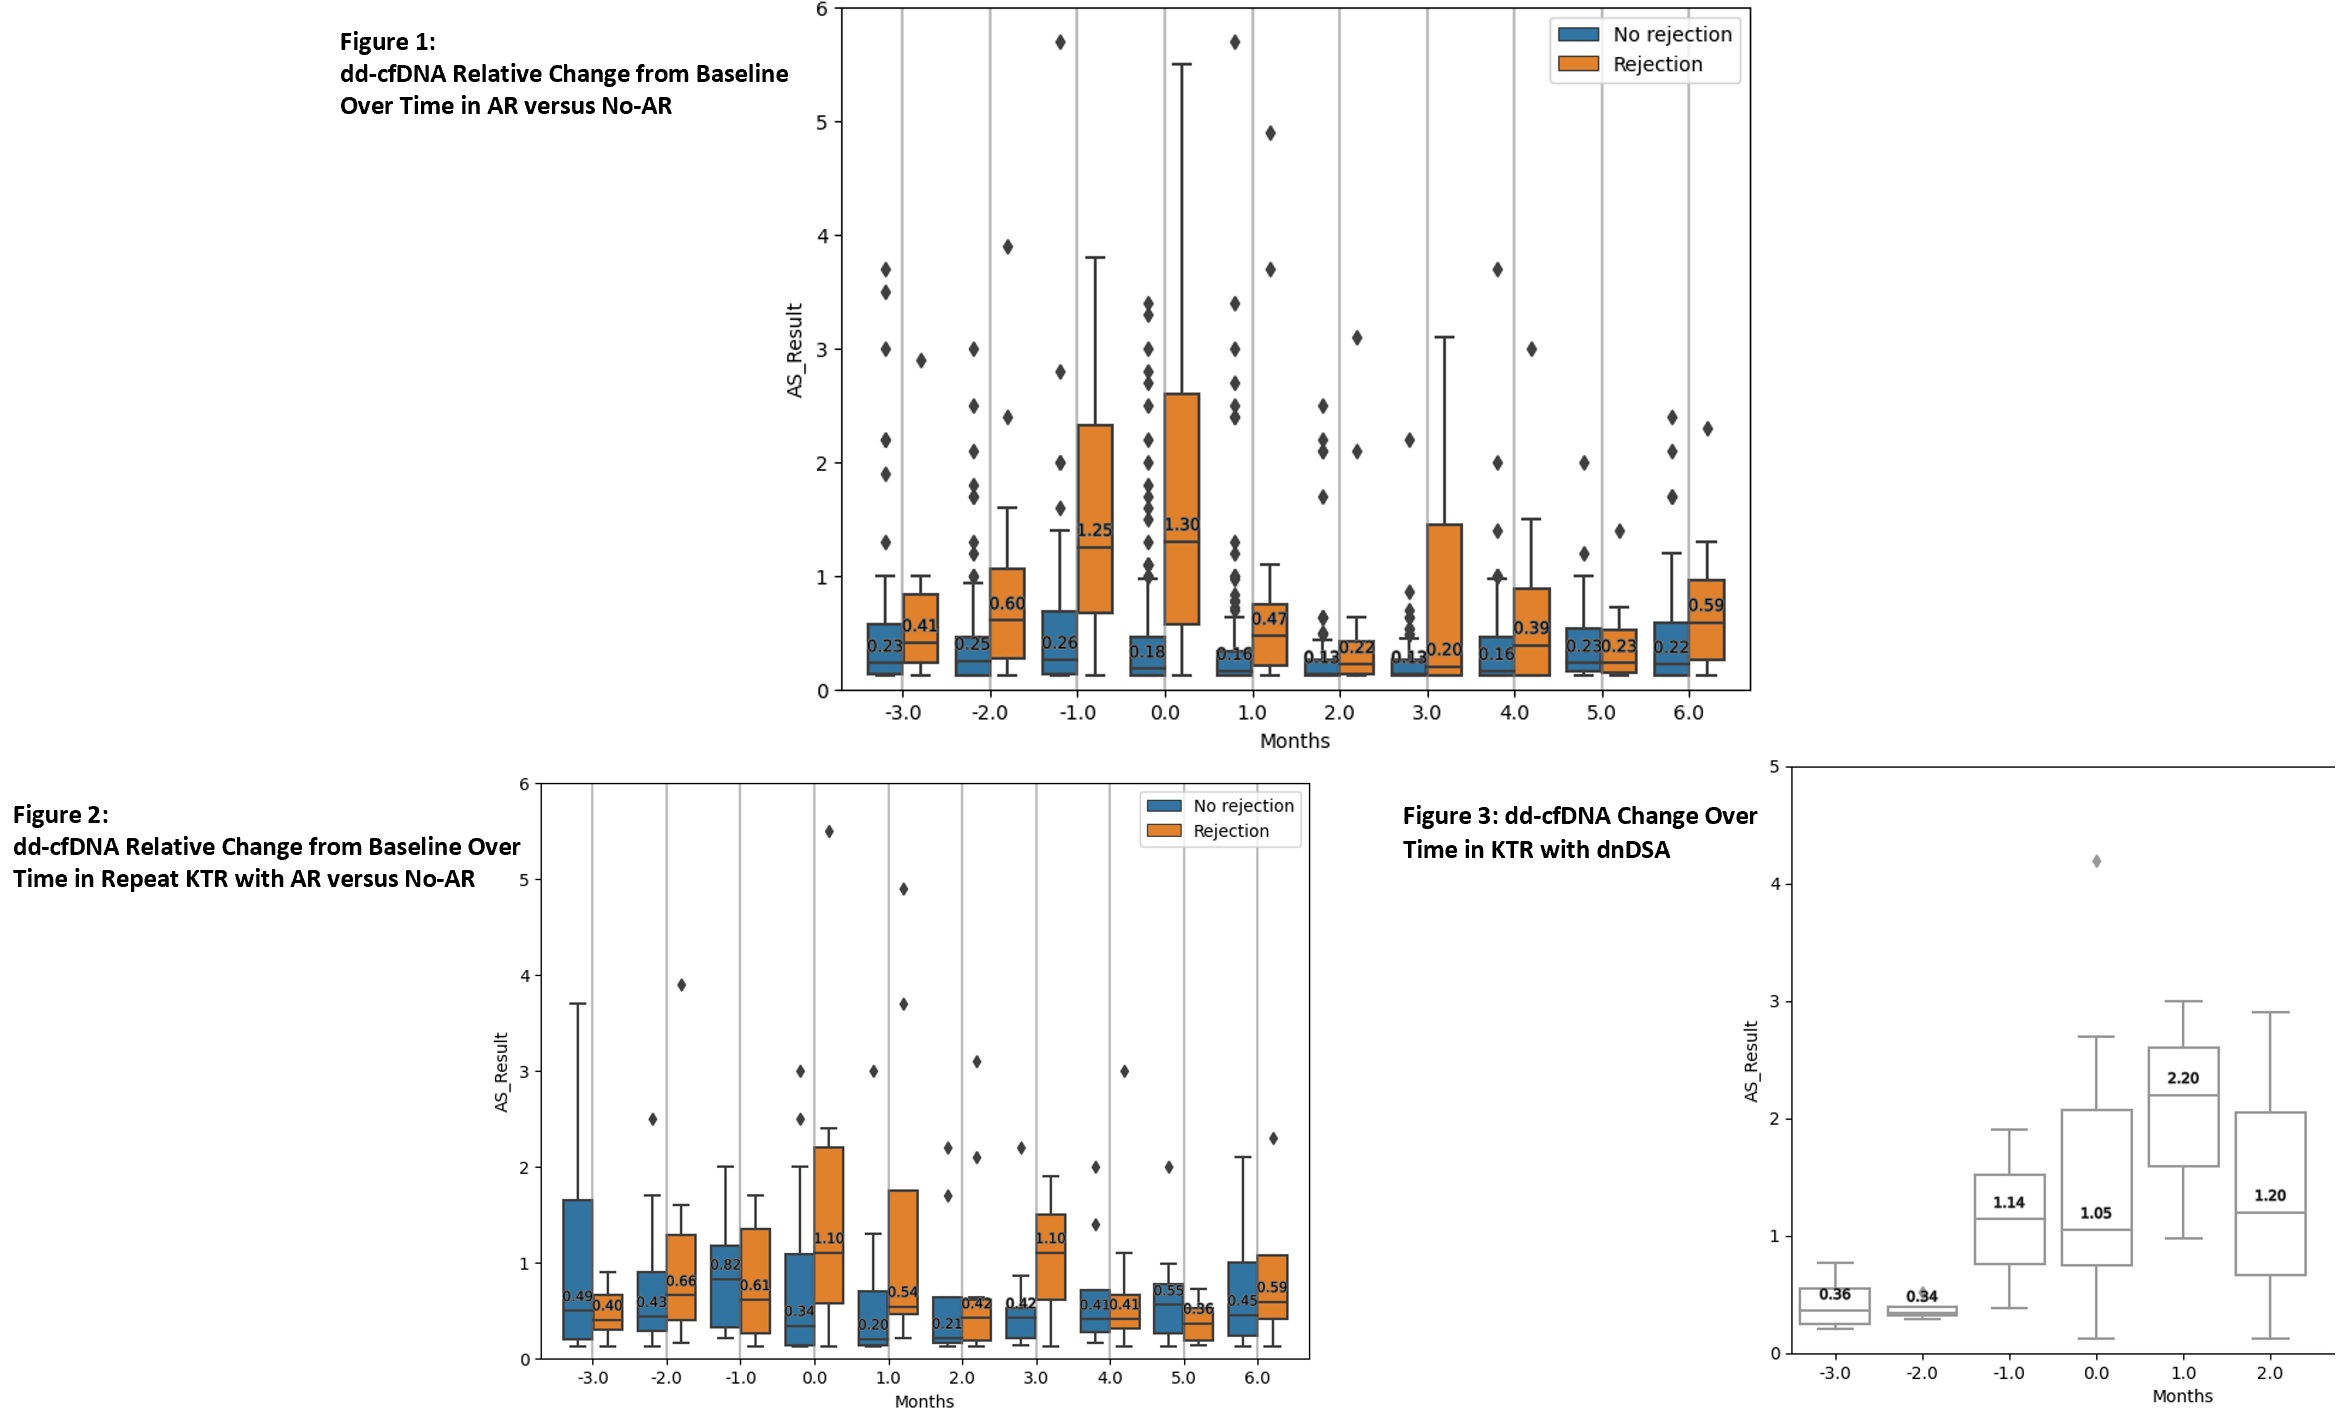
Results: A total of 2603 dd-cfDNA draws from 151 KTR were analyzed [AR = 56 KTR, No-AR = 95 KTR]. Most baseline characteristics were similar among groups [Table 1]. In the AR group, dd-cfDNA rose ahead of diagnosis with a median rise from baseline of 75% at -3 months, 32% at -2 months, and 325% at -1 month before biopsy [Figure 1, Table 2]. At time of biopsy (month 0), the median rise in dd-cfDNA from baseline was 291% (IQR 88-1081%) in AR and 17% (IQR 0-194%) in No-AR (p<0.0001). Following biopsy and treatment, dd-cfDNA values fell in the AR group with a median change from baseline of 94.7% at +1 month, 10.5% at +2 months, and 0% at +3 months. These trajectories were not observed in the non-AR group. A similar trend was seen in repeat KTRs with AR [Figure 2, Table 2]. A rise in median dd-cfDNA was also seen between months 1 to 2 preceding dnDSA detection [Figure 3]. Median change from baseline to dnDSA detection was 141% (IQR 112-574%). RCV in the quiescent population (n = 16) was 70%.
Conclusion: Our data validate the importance of serial monitoring of dd-cfDNA in identifying a patient-specific baseline and trending relative change from baseline. The significant changes from baseline observed before and after AR show how serial monitoring enhances dd-cfDNA utility by allowing for earlier identification of evolving injury and monitoring response to treatment.


[1] Graft Rejection
[2] Donor derived cell-free DNA
[3] dnDSA
